Introduction
The implementation of any computer automation in any manufacturing unit requires one to conduct a benefits study for its economic justification. A benefit study typically looks at all aspects of project implementation and presents its recommendations to corporate management for funds approval based on the cost and benefits analysis in the study. Sometimes, the project may be approved, despite its unfavorable pay-back period, because of strategic planning of automation in a particular plant and the management’s commitment to bring the plant at par with other similar units in the world.
This blog examines many implementation aspects for an integrated oil movement and storage system in a refinery and discusses all factors affecting the economic justification for its computer automation.
Data analysis
Any benefit study must establish the base to recognize estimated benefits and this is done by analyzing the operational data either for a specific process unit or entire area operations. The period for such operational data must be between 4-12 months. In case of off-site operations in a refinery, it is necessary to collect the following information for each OM&S movement task for a period of a minimum of 4 months:
- Identification no.
- Start/end date/time
- Source/destination identification
- Source/product name
- Initial/final levels of source
- Initial/final levels of destination
- Initial/final and total quantity transferred
- Planned volume or weight for transfer
This data can be transferred to a relational database to extract and print various types of information about the OM&S activities at the refinery. The database must also include the following additional peripheral information.
- Type of Source and Destination – The source and destination of each OM&S task should be identified as one of tank, ship, pipeline, truck, or (process) unit.
- Identification of OM&S Areas – Refinery is usually divided into a number of areas based on the products and various circuits. This information can be used to label various filed equipment such as pumps, MOV, etc., in each of the designated OM&S areas.
- OM&S Activity – Depending upon the source and destination types, various OM&S activities must be identified, given an activation code, and entered into the database.
- Designation of OM&S Areas – Each OM&S activity must be assigned a refinery area based on its source, destination, or product type. Also, the basis for the calculation of transferred volume depended upon either source or destination.
- OM&S Equipment Data – The OM&S database must also contain information about the OM&S-related equipment such as tanks, valves, and pumps. This is necessary for the area-wise cost estimation of automation and generating sequences for the path selection and start and stop sequences for the task definition and control applications. Once all OM&S data is collected and converted into a relational database with the above additional information, various users can be retrieved and plotted or printed.
Figure 1 shows a typical daily variation of a number of OM&S tasks in a typical refinery and shows that an average number of 80-90 OM&S tasks are performed on a daily basis in a typical refinery.
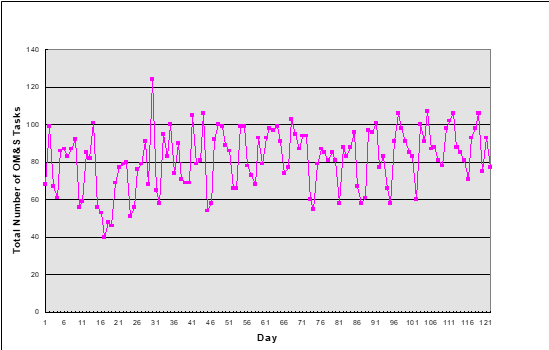

Figure 1. Typical Daily Variation of OM&S Activities
In addition to daily OM&S tasks load for the refinery, it is also important to know the cross-relationship of OM&S activities with designated refinery processing areas. A typical cross-distribution of OM&S activities with refinery areas is shown in Figure 2. Figure 2 shows that five major activities with the highest numbers of tasks per task types are:
- Unit to tank (Aromatics)
- Pipeline to tank (Ballasts and Slops, Fuel Oil)
- Tank to truck (Fuels Oil, Naphtha)
- Tank to ship (Fuel Oil)
- Ship to tank (Ballast and Slops)
However, the ratio of total tasks per task type is not an indication of the importance of the task type for drawing any conclusion regarding its automation but should be viewed in detail during the engineering phase with their total numbers of tasks and task types.
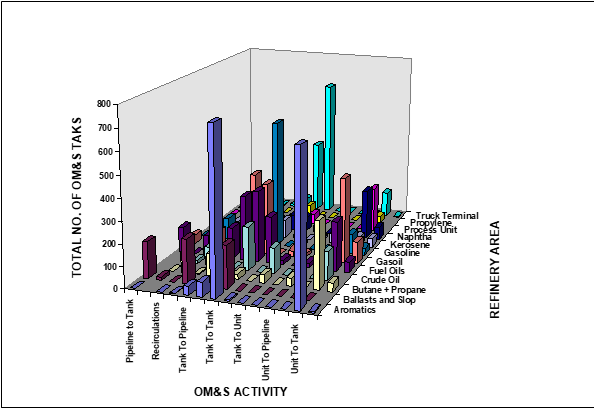

Figure 2. Cross Distribution of Total no. of OM&S Tasks
One of the most important aspects of OM&S activities is their execution frequencies to get an idea of the most common and frequently OM&S tasks carried out in the refinery. The task frequency for each distinct OM&S task type is calculated by dividing the total number of days in the period of raw OM&S data, by its total numbers of tasks. Task occurrence frequency is then defined as the number of days elapsed between two consecutive tasks of the same type consisting of the same source and destination.
Figure 3 below shows the distribution of the number of task types versus the task occurrence frequency and it can be seen from this graph that a majority of task types occur infrequently, that is, once in more than 2 months.
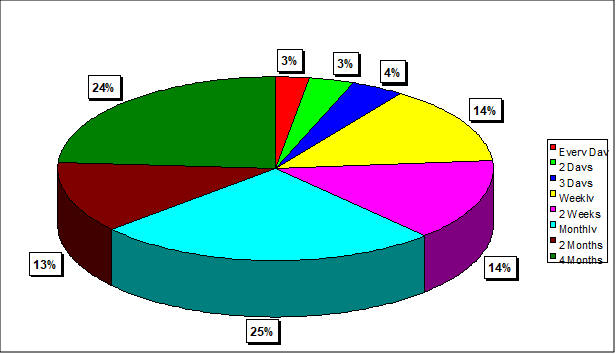

Figure 3. Percentage Distribution of Task Occurrence Frequencies
Based on the analysis of the OM&S operations, we can extract the following information about the OM&S operational characteristics of the refinery.
- Major OM&S activities – Typically 75% of OM&S activities in a refinery are tank to tank, unit to tank, tank to truck, and tank to ship.
- Major refinery areas with the most OM&S tasks – Typically, Aromatics, crude oil, gas oil, gasoline, and truck terminal have most of the OM&S activities.
- Task occurrence Frequency – Typically 45-50% of OM&S tasks occur only less than once per two months and occur more than once every two periods.
Benefits
The estimation of benefits falls into two categories; tangible and intangible benefits. Tangible benefits are actually estimated using the OM&S operation data. Intangible benefits are only good estimates of indirect incentives from the modernization of OM&S operations. Typically, potential OM&S benefits areas are:
- Product Contamination
- Quality/quantify Giveaway
- Demurrage (marine operations)
- Batch product blending (other than in-line product blending)
- Crude Blending
- Manpower Reduction
The following typical OM&S tasks are responsible for the possible cause of errors and their direct/indirect effects on the lost benefits.
- Lineup of Movements
- Drainage of water
- Planning of movement schedules
- Loading/unloading of Products / Feeds
Potential benefits areas and their sources must be cross-linked with respect to the following contributing parameters as shown in Table 1 for the lineup of movement.
- Manpower
- Demurrage
- Quality giveaway
- Quantify giveaway
- Increased energy consumption
- Loss of Opportunity
Benefits model equation
The following equation is a representation of the model for the calculation of benefits contributed from various parameters discussed above. Each of the following equations can be applied to each and every cause of the lost benefits. For example, the loss of intangible benefits from each incident of product degradation caused by lineup error can be attributed to losses from manpower, loss of opportunity, increased energy consumption (due to reprocessing), demurrage, etc. Therefore, ‘incident’ would be ‘product degradation due to lineup error’ in the following model equations. Also, all parameters do not necessarily contribute to all tangible OM&S benefits.
Total Benefits, $ / year = MPL$ + DEM$ + QLG$ + QNG$ + ENG$ + LOP$
Where
- MPL$= Yearly benefits due to loss of manpower
- DEM$=Yearly benefits due to demurrage
- QLG$=Yearly benefits due to Quality Giveaway
- QNG$=Yearly benefits due to Quantity Giveaway
- ENG$=Yearly benefits due to increase in Energy Consumption
- LOP$=Yearly benefits due to loss in opportunity
Where above terms are defined as follows:
- MPL$ =(Number of Incidents/ year) * (Lost Man-hours / Incident)* (Cost, $ / Man-hour)
- DEM$ =(Number of Delayed Ships/year) * (Average hours of delays / Ship) *(Cost of Demurrage, $ / Hour)
- QLG$ =(Number of Incidents/year) * (Quantity of Material, M3/Incident) * (Difference in Quality Giveaway ) * (Cost of Quality Giveaway, $ /Quality Giveaway -M3)
- QNG$ = (Number of Incidents/year) * (Delta Quantity Giveaway, M3/incident ) *(Cost of Material , $/M3)
- ENG$ =(Number of Incidents/year) * (Delta Increase in Energy, KWH/Incident) * (Cost of Energy, $ / KWH)
- LOP$ =(Number of Incidents/year) * (Delta Profit from Sale of Cargo/Incident)
As discussed before, OM&S benefits are categorized into tangible and intangible benefits and are listed below. The tangible benefits do not include in-line product blending and therefore account for OM&S operations only.
Tangible OM&S benefits
- Line Displacement during Marine loading/unloading
- Line Displacement during tank-to-tank transfer
- Blending
- Measurement Errors
- Water in Crude (free water and imbedded water)
- Spills
- Leakage
- From Line Displacements
- During Tank to Tank Transfer
- Automatic lineup
- Minimizing the ship loading/unloading delays
5. Decrease in Utility Consumption by
- Reducing recirculation tasks
- Reducing or Eliminating unnecessary tasks
- Maximizing of Crude Processing
- Reducing product losses in drained water from tanks.
- Optimizing Crude tanks Qualities
- Crude tanks monitoring
- Providing automatic Generation of OM&S task
- Providing automatic task data entries in OM&S System
- Operators
- Office
Intangible OM&S benefits
In addition to the tangible benefits of the OM&S automation as mentioned earlier, there are many intangible benefits also. There is no economic value associated with these benefits that can be calculated easily but are necessary to consider from the overall automation of a refinery. These intangible benefits are listed below.
- Quality Giveaway by lineup Errors
- Quality Giveaway by Illegal movements
- Time Reduction by “just in time” manufacturing
- Increase in thruput by minimizing reprocessing of slops
- Better Planning and Scheduling by Crude loading scheduling coordination
- Better usage of management information system by making available online inventory information
- Minimizing Environmental impact by minimizing spills
- Minimizing Environmental impact by minimizing equipment leakage
- Better Equipment Utilization by Proper Maintenance
- Better Equipment Utilization by Timely Repair
- Better Equipment Utilization by Reducing Operator work-load by automation
Typical OM&S benefits
| No | Benefit Area | Typical Benefits, KS/Year |
| 1. | Quality Giveaway | 40-50 |
| 2. | Product Contamination | 4-6 |
| 3. | Time Reduction | 400-600 |
| 4. | Quantity Giveaway by Measurement Errors | 500-700 |
| 5. | Reducing or Eliminating OM&S tasks | 400-600 |
| 6. | Increasing Tank Utilization | 500-600 |
| 7. | Integration of OM&S with Computer Applications | 300-500 |
| 8. | Increasing Crude Throughput by Crude Blending | 2,400-3,000 |
| 9. | Planning and Scheduling of ship unloading | 200-300 |
| 10. | Crude Feed Quality Control and Monitoring | 200-300 |
| 11. | Minimization of spill and leakage | 95-140 |
| 12. | Lineup errors and illegal movements | 50-315 |
| 13. | Minimization of product loss in water drainage | 25-40 |
| 14. | Better utilization of OM&S equipment | 60-155 |
| 15. | Better planning and Scheduling | 60-100 |
| 16. | Manpower Reduction | 40-1,250 |
| Total Typical OM&S Benefits | 5,000-8,500 |
OM&S Automation Functions and Incentive Relationships
This blog has enumerated benefits either identified and calculated tangible benefits for them or estimates based on some guidelines and engineering judgment. It would be interesting to know how each one of these incentives relates to the functions of the OM&S automation system. This matrix relationship is shown in Table 3 as OM&S automation incentives versus OM&S control functions.
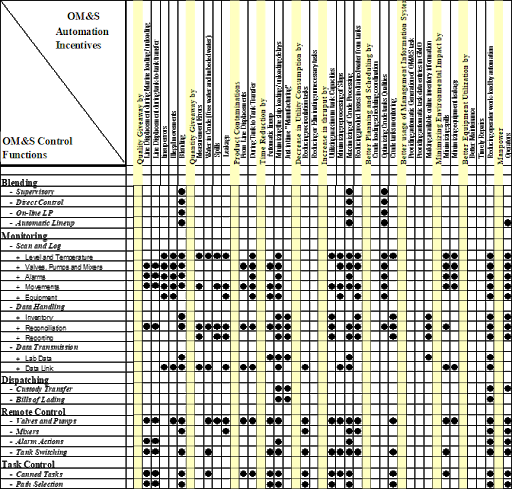

Table 3. OM&S Control System Functions/Incentive Relationship
Field instrumentation
Based on the analysis of data for the OM&S operations, and area-wise division of the following criterion may be chosen for the automation of OM&S tasks of any refinery.
- Tasks for a given OM&S area and activity should be automated in the order of potential benefits
- Only those task types should be automated which have a task occurrence frequency of more than once per month.
- Valves with sizes greater than 14″ should be automated, that is make them motor-operated remote valves, regardless of their belonging to either area or OM&S activity.
- All other valves not satisfying the above criteria and which are not either “always closed” or “always opened” should have limit switches for indication of their status in the computer.
- All pumps should be automated and should be able to operate remotely from a console or computer.
- Although all the OM&S activities in the crude oil area do not satisfy criteria-2 above, they should all be fully automated because of the greatest benefits from the automation of crude blending.
Motor-operated valves (MOV’s) versus limit switches
In order to determine the additional number of motor-operated valves and limit switches, the following options can be evaluated for “what if” analysis of their cost point of view.
- Option-1: Automate all manual valves in areas, except those which are “always open” or “always closed”.
- Option-2: Automate only those all valves used in the most common and frequently executed tasks or of sizes greater than 14″ and install limit switches on the rest of all manual valves.
- Option-3: Similar to option-1 but automate all manual valves for high benefit areas such as crude oil, gas oil, gasoline, and fuels oil only.
Interface with Computer
- Open and close remotely operated valves (ROVs)
- Start and stop remotely operated pumps and mixers
- Determine whether a “key” or “path isolating” manual valve is in an open or closed position
- Read tank levels
Survey of field automation in other refineries worldwide
It is worthwhile to compare the extent of the automation of other refineries in the world.


Table 4. Comparison of State of Field Elements Automation in Refineries Worldwide
Computing system
- Calculate inventories, conditional events, total volumes shipped.
- Monitor tanks for improper movements, alarm on high, low levels.
- Monitor remotely operated valves (ROVs), pumps, and mixers for alarm conditions and proper response operator requests.
- Keep a list of out-of-service equipment.
- Provide status information to an operator.
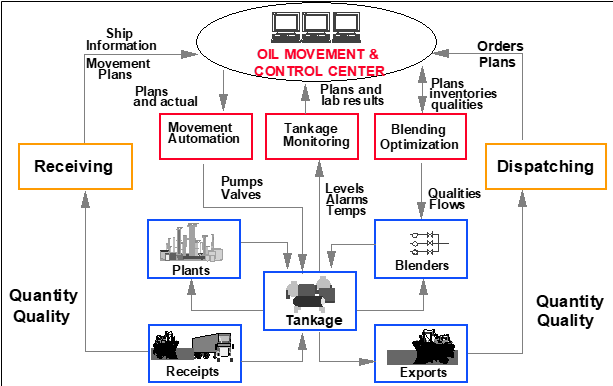

Figure 4. Integrated OM&S Computer Control System
Cost and benefits
| Item | Cost and Benefits | $M |
| Costs | 4-6 | |
| Field equipment and DCS Interface | 2-3 | |
| Computer hardware & Software | 1.5-2 | |
| Engineering Services & Start-up | .5-1 | |
| Benefits | 2-3 | |
| Pay-back period | 1.5-3 years |
Summary
This blog has discussed the factors important for the economic justification of the automation of an oil movement and storage (OM&S) system in a refinery. The author recommends conducting a detailed benefit study to determine accurately the cost and benefits of OM&S automation for a specific refinery. Also, it is easier to justify an OM&S system with product blending automation than alone as OM&S has more intangible benefits and therefore is difficult to estimate.
References
- Agrawal, S. S., “Scope Of An Integrated Oil Movement & Storage (OM&S) Control System “, Proceedings of ISA Conference, New Orleans, October 1995.
- Brooks, Robin, “Experiences with Oil Movements and Storage (OM&S) systems within Integrated Refinery Management Systems”, Cc-93-128, Proceedings of NPRA Computer Conference, New Orleans, November 1993.
- Czech, Robert S., “The Application of Computer Systems in Refinery Oil Movement Operations”, Proceedings of ISA Conference, Philadelphia, May 1983.
- OM&S General Information Manual, IBM Process Plant Computing Center, Greenford, Middlesex, UK 1993.
- Oil Movement Control System Application Summary, Control Data Corporation, Publication No. 96767740.
- Kuo, C.J., “Computer Simulates Refinery Oil Transfer”, Oil & Gas Journal, Jan 21, 1980, pp. 59-62.
- Advanced Process Control handbook IV, Hydrocarbon Processing, March 1989.
- Oil Movement & Storage, Sales Brochure, Honeywell, Inc.
#MinimizeQuantifyGiveaway #BlendDataAnalysis #CrudeFeedQualityControl #RovOpenlyOperatedValves #UtilizationOm&SEquipment #RovCloselyOperatedValves #Om&SAutomationFunctions #Off-SiteRefineryOperations #MotorOperatedValvesNumber #OilMovementStorage #ProductDegradationLineupError


1 2 3 4 5 100%
1 2 3 4 5 0%
1 2 3 4 5 0%
1 2 3 4 5 0%
1 2 3 4 5 0%